
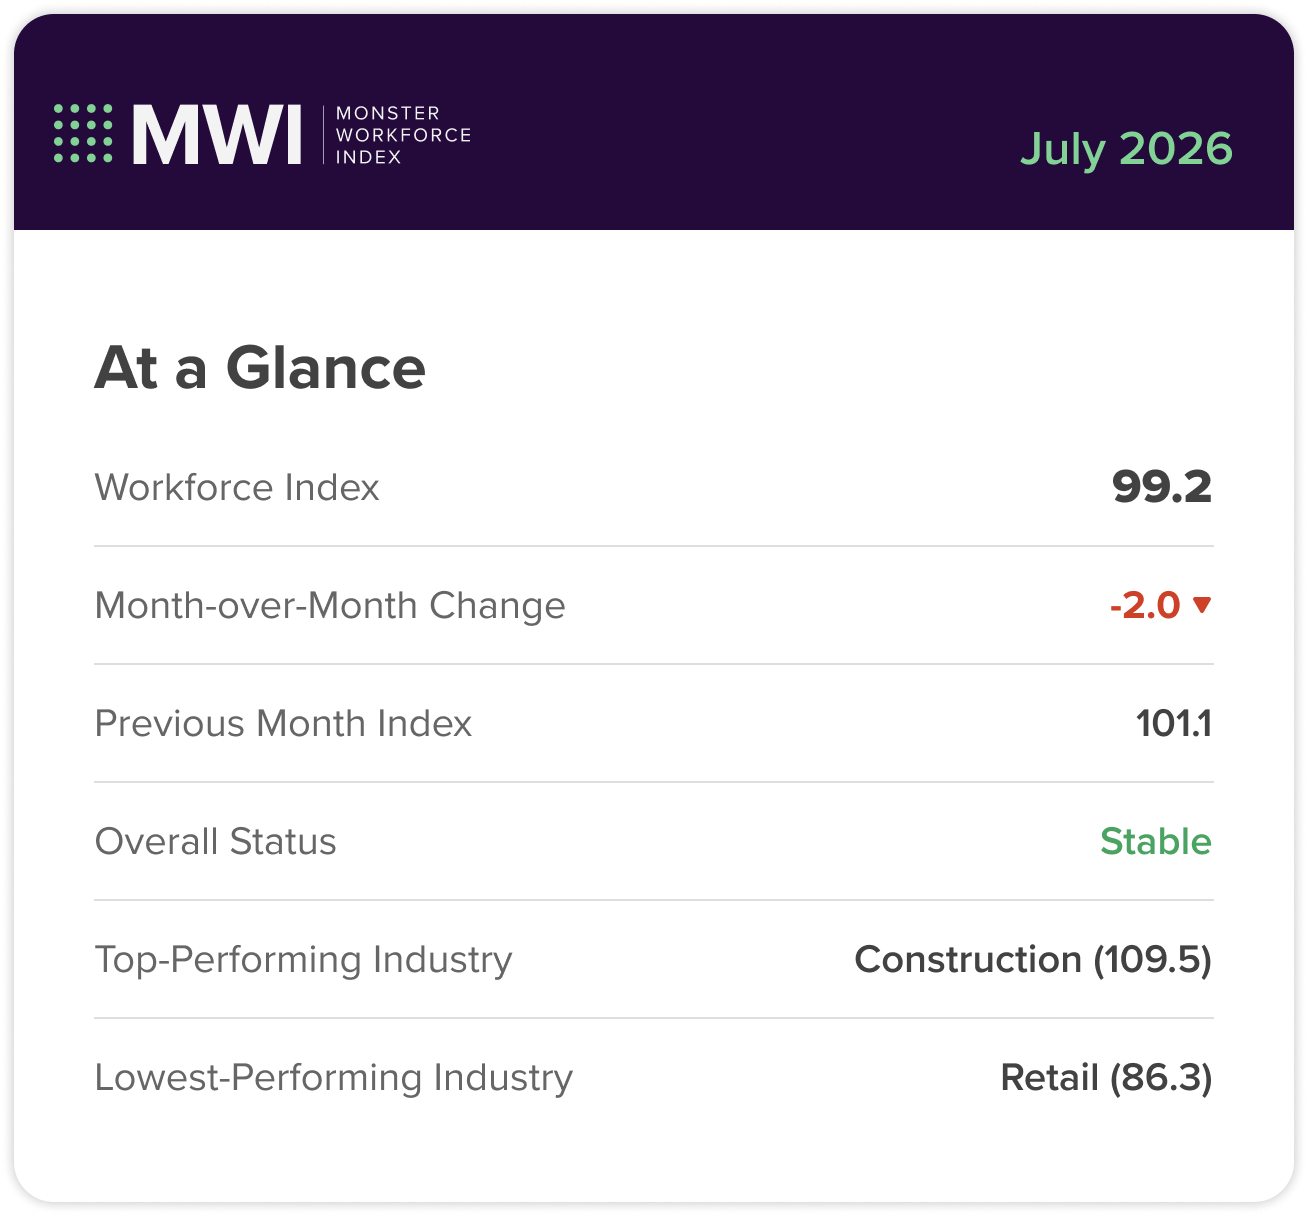
The Monster Workforce Index decreased to 99.2 in July, moving back into the Stable range as industry performance remained mixed.
The Monster Workforce Index measured 99.2 in July 2026, a decrease of 2.0 points from June’s reading of 101.1. The July reading places the national Workforce Index in the Stable range, slightly below its historical benchmark of 100.
For employers, the July reading shows why sector-level movement matters: hiring conditions softened nationally, but several industries continued to strengthen.
July at a Glance
Notable Changes
Compared with June 2026:
- The national Workforce Index decreased 1.9 points.
- Construction moved into the top spot.
- Retail remained the lowest-scoring industry.
- Utilities recorded the largest month-over-month increase, rising 8.4 points.
- Retail recorded the largest month-over-month decline, falling 4.3 points.
- Twelve industries increased, while eight declined.
Industry Highlights
Industry performance was mixed during July. Construction recorded the highest Workforce Index score at 109.5, followed by Holding Companies at 109.4 and Oil, Gas and Mining at 108.0. Less than two points separated the three highest-scoring industries.
Retail remained the lowest-scoring industry at 86.3, followed by Administrative and Support Services at 91.3 and Entertainment Providers at 92.7.
Utilities recorded the largest month-over-month increase, rising 8.4 points. Oil, Gas and Mining followed with an increase of 6.8 points, while Construction gained 4.2 points.
Retail experienced the largest decline, falling 4.3 points. Financial Services decreased 3.3 points, and Government Administration fell 3.3 points.
The variation between industries shows that the national decline was not universal. Some sectors strengthened considerably even as the overall index moved slightly below its historical benchmark. These differences may affect where employers face greater competition for talent, where candidate availability may be tighter, and where hiring teams may need to adjust expectations.
Using the Index to Guide Your Hiring Strategy
The Monster Workforce Index is designed to help employers understand whether labor market conditions are strengthening, stabilizing, or cooling relative to a historical benchmark.
A national score can provide a useful snapshot, but the industry-level scores are especially important for workforce planning. Employers should use the index to compare hiring conditions by sector, monitor month-over-month movement, and identify where recruiting pressure may be rising or easing.
The most useful takeaway for hiring teams is not whether the market is just “good” or “bad.” It’s where conditions are changing, which industries are moving differently from the national trend, and how those shifts may affect recruiting strategy.
About The Monster Workforce Index
The Monster Workforce Index is a monthly measure of U.S. labor market conditions developed by Monster. The index is updated monthly and combines proprietary Monster marketplace data with selected public labor market indicators into a single standardized score centered on a historical benchmark of 100.
Score Interpretation:
- Above 110: Strong
- 100-110: Healthy
- 90-99.9: Stable
- Below 90: Cooling
The national index incorporates seven labor market indicators:
- Hiring speed, or the average time required to fill job postings
- Median compensation, based on median advertised salary
- Multiple jobholding rate, or the percentage of workers holding more than one job
- Net job postings, reflecting overall employer hiring demand
- Part-time hiring ratio, comparing part-time job postings relative to full-time postings
- Resume-to-posting ratio, reflecting candidate supply relative to available jobs
- Unemployment rate
Individual measures are standardized and combined into a composite index to provide a monthly snapshot of how labor market conditions are shifting relative to the historical benchmark.